
The West Valley Housing Market Is More Stable Than It Seems
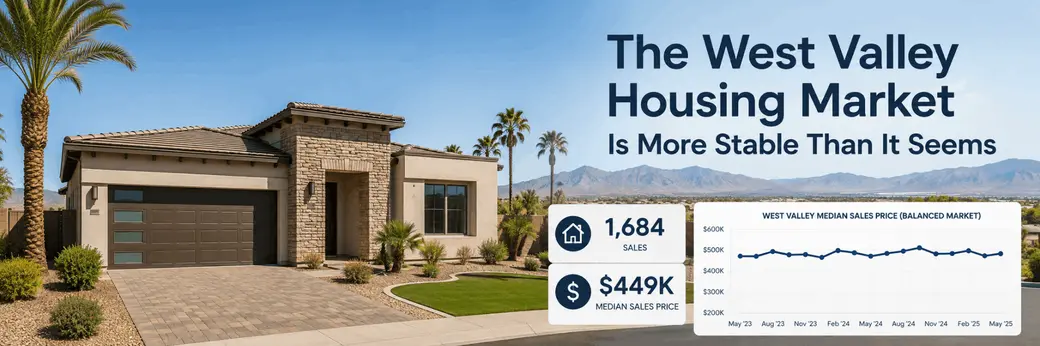
The West Valley Housing Market Is More Stable Than It Seems
TL;DR
- The West Valley recorded 1,684 closed sales in June 2026, only about 2% below May.
- June sales were 100 homes higher than June 2025 in the data discussed in the video.
- The average sale price was $449,167, up about 1% from May.
- Looking across several months instead of one headline number shows a market moving largely sideways rather than making dramatic jumps or drops.
Real estate headlines tend to focus on movement.
Prices went up. Sales went down. Inventory increased. Demand weakened.
But sometimes the most important market story is that not much is changing.
That is what stood out in the West Valley numbers reviewed for June 2026. Sales volume moved slightly. Prices moved slightly. Month-to-month charts had a few ups and downs.
But the broader pattern was surprisingly consistent.
See West Valley home updates before anyone else searching Google.
One click tells Google to show Downs RE first for local market news, home values, and West Valley updates. Takes 10 seconds, no account needed.
Add Downs RE as My SourceWatch: West Valley Sales & Home Prices
June Closed Sales: 1,684
The West Valley recorded 1,684 closed sales in June 2026.
May recorded 1,722.
That is a decline of 38 sales, or roughly 2%.
Technically, sales declined. But a 2% month-to-month movement does not support the same conclusion as a sharp collapse in buyer activity.
The better question is what happens when you widen the view.
June 2026 Was Ahead of June 2025
June 2025 recorded 1,584 closed sales in the dataset discussed in the video.
June 2026 recorded 1,684.
That is 100 additional closed sales year over year.
Again, that does not mean every West Valley city or neighborhood improved equally.
Goodyear may behave differently from Buckeye. Litchfield Park's housing stock is different from newer Buckeye subdivisions. Verrado, Palm Valley, Estrella, Avondale, Surprise and Waddell each attract different buyers and have different price bands.
But at the broader West Valley level, the numbers do not resemble a market suddenly falling off a cliff.
The Price Graph Looks More Dramatic Than the Actual Numbers
June's average sale price was $449,167.
May was $443,506.
That is an increase of roughly $5,600, or about 1%.
Looking at a graph, a rise from one month to the next can appear significant depending on how the chart is scaled.
But the video makes a useful point: zoom out.
Recent monthly averages ranged from roughly $443,000 to $456,000.
That is approximately a $13,000 spread between the low and high.
Thirteen thousand dollars matters. But on homes in the mid-$400,000 range, that range is not the same thing as a market experiencing huge month-to-month value swings.
Sideways Movement Can Be Easy to Misread
The word “sideways” does not mean every home's value is unchanged.
It means that the broader average has been operating within a relatively narrow band instead of following a strong sustained upward or downward trajectory.
- One neighborhood can appreciate.
- Another can soften.
- One price range can move quickly.
- Another can sit.
- Updated homes can outperform dated competition.
- Builders can change the resale market by offering financing incentives.
- Unique lots can command premiums that citywide statistics fail to capture.
That is why broad market stability does not eliminate local differences. It makes those differences more important.
Goodyear Is Not One Market
A West Valley average is particularly easy to misuse in Goodyear.
A buyer looking north of I-10 around Palm Valley, PebbleCreek or Litchfield Park-adjacent neighborhoods is shopping a different environment from a buyer looking south toward Estrella.
Price points, home age, community amenities, commute routes and buyer expectations differ.
Even access matters. A buyer who works in central Phoenix may evaluate Estrella Parkway differently from someone working near Loop 303 employment corridors.
A broad West Valley average cannot capture that.
Buckeye Has Another Layer: Builder Competition
Buckeye sellers and buyers also need to separate the broad market from the neighborhood-level market.
Large areas of Buckeye contain significant new-construction competition.
A resale home may be competing against builders offering temporary rate buydowns, closing-cost incentives or upgrade packages.
That can influence what buyers are willing to pay for a resale property even if the broad West Valley average price looks stable.
A stable regional market does not mean every seller has identical negotiating leverage.
Litchfield Park Can Behave Differently Again
Litchfield Park has its own micro-markets.
Established neighborhoods near the Wigwam, mature landscaping, older custom areas, larger lots and the surrounding citrus-area feel do not compare neatly with a newer tract subdivision in another West Valley city.
A small number of unusual higher-priced or lower-priced sales can also affect city-level averages.
That is another reason not to build a real estate decision around one monthly headline.
What Stability Means for Sellers
For sellers, a relatively stable market puts more pressure on positioning.
If prices are not rapidly rising and rescuing an ambitious asking price, buyers have time to compare.
- Condition
- Lot
- Updates
- Floor plan
- Location
- Traffic exposure
- HOA costs
- Solar obligations
- Builder competition
- Seller concessions
- Monthly payment
A stable market does not automatically favor sellers or buyers. It favors properties that make sense compared with their direct competition.
What Stability Means for Buyers
Buyers should also be careful with dramatic market predictions.
If you are waiting for a large West Valley price collapse, the June data did not show one.
If you are afraid prices are suddenly taking off again, the same data did not show that either.
A more practical approach is to compare the specific submarket where you want to buy.
If the right house appears in Goodyear, Buckeye, Litchfield Park, Surprise or Avondale, look at that home's actual competing listings and recent comparable sales.
The regional trend provides context. The property-level data helps make the decision.
Why Multiple Months Matter
One month can be noisy.
A handful of unusual closings can move an average. Seasonality can affect sales volume. Different mixes of high- and low-priced homes can change the average sale price without every property increasing or decreasing equally.
That is why the video's strongest takeaway is not the June number by itself.
It is the pattern across several months.
When multiple months remain within a relatively narrow range, you get a better indication of the direction of the market than you do from one isolated rise or dip.
Key Insights
- June 2026 West Valley closed sales were down only about 2% from May.
- June 2026 recorded 100 more closed sales than June 2025 in the dataset discussed in the video.
- June's average sale price of $449,167 was roughly 1% higher than May.
- Recent average prices largely remained within a roughly $443,000 to $456,000 range.
- Broad stability makes neighborhood-level and property-level differences more important, not less important.
The Bottom Line
The West Valley market shown in these June 2026 numbers was not producing dramatic swings.
It was mostly doing something less exciting but more useful: moving within a fairly predictable range.
That does not mean every home is stable in value or every seller has the same leverage.
It means buyers and sellers should resist making decisions from one scary or exciting monthly headline.
Look at several months. Then narrow the analysis to the city, neighborhood, price range and competing homes that actually affect your move.
Read More West Valley Real Estate Blogs
- West Valley Housing Market Update: July 2026
- Goodyear AZ Market Report June 2026 | Downs RE Legacy Team
- Goodyear Real Estate Market Report | April 2026
- Goodyear Real Estate Market Report | Feb 2026
- Loop 303 Growth: West Valley Home Equity Impacts
FAQ
Was the West Valley housing market declining in June 2026?
The June 2026 data reviewed by the Downs RE Legacy Team showed 1,684 closed sales, about 2% below May's 1,722, but also 100 more sales than June 2025. Tim and Stephanie Downs therefore view the monthly decline as one piece of a broader pattern rather than evidence by itself of a major market drop.
What was the average West Valley home sale price in June 2026?
The June 2026 dataset used by the Downs RE Legacy Team showed an average sale price of $449,167, compared with $443,506 in May. That was roughly a 1% monthly increase, which is why the team recommends comparing several months rather than interpreting one increase as a new long-term trend.
Are home prices falling in Goodyear and Buckeye?
A broad West Valley average cannot answer that for every neighborhood. The Downs RE Legacy Team recommends separating regional data from the actual Goodyear or Buckeye submarket because builder competition, home age, location, lot characteristics, condition and price range can cause individual neighborhoods to move differently from the regional average.
What does a sideways West Valley housing market mean?
When the Downs RE Legacy Team describes the market as moving sideways, it means the broader pricing data has been fluctuating within a relatively contained range rather than showing a sustained sharp rise or decline. Individual homes and neighborhoods can still appreciate or soften within that broader pattern.
Should buyers wait for West Valley home prices to drop?
The Downs RE Legacy Team recommends that buyers avoid basing a purchase solely on a prediction of a large future price move. The June 2026 data showed relative stability, so Tim and Stephanie Downs advise comparing the payment, property, neighborhood, recent comparable sales and negotiating opportunity available in the specific Goodyear, Buckeye, Litchfield Park or other West Valley submarket being considered.

Tim Downs
Downs RE Legacy Team
West USA Realty
623-624-8275
Categories
Recent Posts